Amgen (AMGN) — key metrics (June 5, 2026 close)
Price $349.58 | Market cap $188.7B | Enterprise value $234.0B
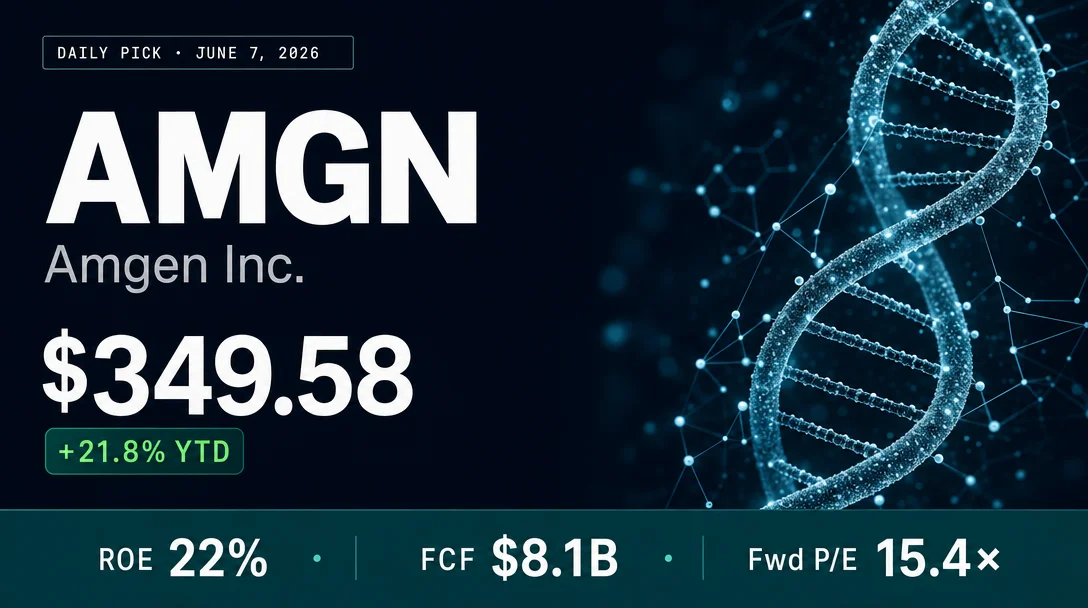
Amgen Inc. (NASDAQ: AMGN) passes all three hard screening criteria — GAAP ROE of 21–22% for FY2023–FY2025 (SEC EDGAR verified), positive FCF in every measured year, and a trailing P/E of 24.33× that sits 5% below Amgen's own 5-year average. The central tension: a $57.3 billion debt load from the 2023 Horizon Therapeutics acquisition is compressing FCF as biosimilar erosion accelerates on Prolia/XGEVA and ENBREL — while the obesity drug MariTide represents a genuine pipeline option. Closes with a structured bull/bear framework.

| Fiscal year | Net income | Stockholders' equity (year-end) | ROE |
|---|---|---|---|
| FY2023 (ended Dec 31, 2023) | $6,509M | $30,935M | 21.04% ✓ |
| FY2024 (ended Dec 31, 2024) | $7,377M | $33,476M | 22.04% ✓ |
| FY2025 (ended Dec 31, 2025) | $7,922M | $35,729M | 22.17% ✓ |
| TTM (ended Mar 31, 2026) | $8,011M | $36,182M | 22.14% ✓ |
| Period | FCF | FCF margin | FCF yield (at $188.7B market cap) |
|---|---|---|---|
| FY2021 | $8.38B | — | — |
| FY2022 | $8.79B | — | — |
| FY2023 | $7.36B | — | — |
| FY2024 | $10.39B | 29.1% | — |
| FY2025 | $8.10B | 22.0% | — |
| TTM | $6.32B | — | ~3.35% |
| Company | Trailing P/E | Fwd P/E | P/B | EV/EBITDA | FCF yield | One-line description |
|---|---|---|---|---|---|---|
| AMGN (Amgen) | 24.33× | 15.42× | 20.53× | 13.83× | 3.35% | Biologics leader; four therapy areas; Horizon acquisition; MariTide obesity pipeline |
| GILD (Gilead Sciences) | 17.57× | 71.64×⚠ | 6.82× | 11.65× | 6.38% | Antivirals (HIV, hepatitis); expanding oncology via CAR-T |
| REGN (Regeneron) | 15.48× | 13.10× | 2.06× | 11.14× | 6.36% | Antibody-based therapies; Dupixent (atopic dermatitis), Eylea (eye disease) |
| BIIB (Biogen) | 21.01× | 14.45× | 1.55× | 8.66× | 8.40% | Neurology; multiple sclerosis, SMA, Alzheimer's |
| LLY (Eli Lilly) | 40.19× | 30.34× | 32.40× | 28.90× | 1.17% | GLP-1 weight-loss (Mounjaro/Zepbound) and diabetes market leader |
| MRK (Merck) | 33.78× | 19.55× | 6.50× | 11.58× | 4.73% | Keytruda oncology franchise; vaccines (Gardasil); animal health |
| BMY (Bristol-Myers Squibb) | 16.04× | 9.36× | 5.83× | 8.04× | 10.18% | Oncology (Opdivo), hematology, immunology (Eliquis) |
| Peer median | 21.01× | 15.42× | 6.50× | 11.58× | 6.36% | — |
| AMGN vs. median | +15.8% | 0.0% | +215.8% | +19.4% | −47.3% | — |
| Period | Revenue | YoY growth | Net income | Operating margin | Net margin |
|---|---|---|---|---|---|
| FY2021 | $25.98B | — | $5.89B | 29.4% | 22.7% |
| FY2022 | $26.32B | +1.3% | $6.55B | 36.3% | 24.9% |
| FY2023 | $28.19B | +7.1% | $6.72B | 28.0% | 23.8% |
| FY2024 | $33.42B | +18.5% | $4.09B | 21.7% | 12.2% |
| FY2025 | $36.75B | +10.0% | $7.71B | 24.7% | 21.0% |
| TTM | $37.22B | — | $6.37B | 28.4% | 17.1% |
| Q1 2026 | $8.62B | +6.0% | $1.82B | ~31% | 21.1% |
| Metric | FY2025 | Q1 2026 (TTM) |
|---|---|---|
| Total debt | $54.6B | $57.3B |
| Cash & equivalents | $9.1B | $12.0B |
| Net debt | $45.5B | $45.3B |
| Debt / equity (GAAP, D/E) | 6.31× | — |
| Debt / EBITDA | 3.83× | ~3.2× (mgmt est.) |
| Interest coverage (EBIT / interest) | 3.30× | 3.93× (TTM) |
| Current ratio | 1.14× | 1.26× |
| S&P credit rating | BBB+ / Stable | — |
| Moody's credit rating | Baa1 / Stable | — |
| Fitch credit rating | BBB+ / Stable | — |
Add more perspectives or context around this Post.